


")


Cấu hình này mình đã tham khảo từ nhiều nguồn và đã test trên phiên bản zabbix 3.2.11
Tại Server zabbix_agent
-
Contents
1.Cấu hình file default.conf của nginx
server {
	listen       80;
	server_name  localhost;

	location /stub_status {
		stub_status on;
		access_log off;
		allow 127.0.0.1;
		deny all;
	}
}-
2. Tạo userparameter_nginx.conf
cat /etc/zabbix/zabbix_agentd.d/userparameter_nginx.conf
Thêm dòng : UserParameter=nginx.status[*],/etc/zabbix/scripts/nginx.sh $1 -
3. Tạo script :
mkdir -p /etc/zabbix/scripts
vim /etc/zabbix/scripts/nginx.sh
Nội dung script : Download
-
4. Test Script:
Phân quyền thực thi file script : chown +x
/etc/zabbix/scripts/nginx.sh
Chạy lệnh:/etc/zabbix/scripts/nginx.sh accepts để xem các phiên đang truy cập
Các lệnh kiểm tra thông số khác:
{active|accepts|handled|requests|reading|writing|waiting}Khởi động lại zabbix agent :
systemctl restart zabbix-agent.service-
5. Test script trên Zabbix server
# yum install -y zabbix-get

# zabbix_get -s <agent_ip_address> -k 'nginx.status[accepts]'
109
Nếu lệnh trên hoạt động có nghĩa cấu hình tại zabbix-agent đã chính xác
-
6. Import Template monitor Nginx lên zabbix server
Tải file nginx template : Download
-
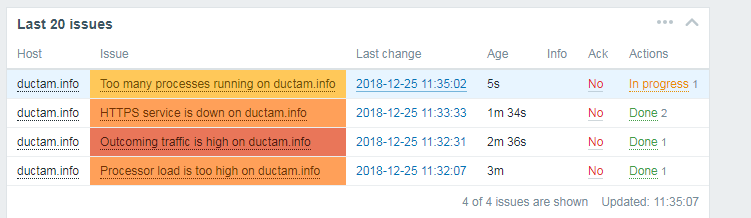
7. Test monitor trên Zabbix server:
Thử ddos xem monitor ra sao :
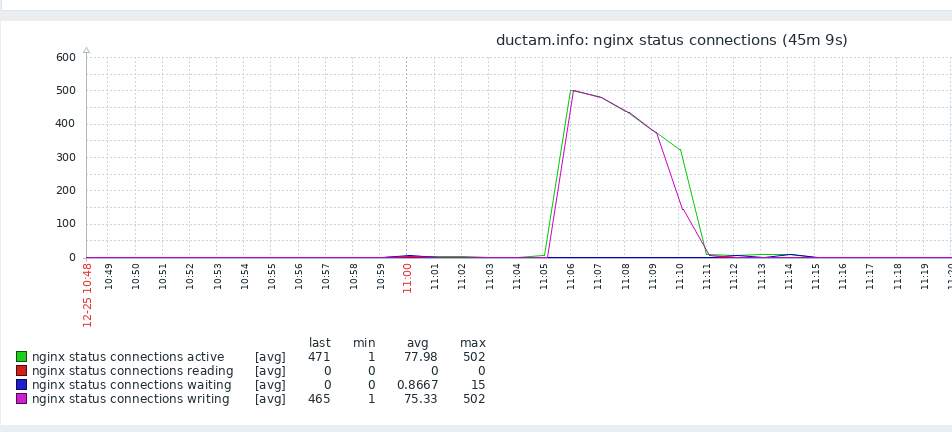
Sập luôn cả dịch vụ :)))


")
Leave a Reply